A new version of my Chrome extension Add Sense is now available. If you’ve already installed an older version it should be updated automatically, if not you’ll find it here.
App box moved
Probably the first thng you will notice is that the app info box now has moved, from bottom right corner to top middle. The old placement blocked som parts of the Qlik Sense UI, hopefully the new one works better.
More sheet info
The sheet info box now has some more info, like if the sheet is published or not, and if you can modify it. One of the mistakes I’ve made most in Qlik Sense app development is that I forget publishing a sheet before publishing the app. This is a reminder to help you avoid that mistake.
Reintroducing ‘Enable copy’
A few versions ago I made a menu alternative to help you with use copy and paste in Qlik Sense. I wasn’t totally satisfied with how this worked, so in a previous version I removed the ‘Enable copy’ feature. But it seems like users used that, in ways I didn’t think of, so now it’s back again.
Property panel definition
Lastly I’ve added a small new feature: if you’re in advanced edit mode and the property panel is visible, you will be able to see it’s definition. That can help you if your property panel does not work as you expected.
One of the recent new features in Qlik Sense is the ability to add filters to charts, filters that applies only to the chart they are included in, not other charts. So far this is only available n Qlik Sense Clod. (Help is available here)
It has always been possible to filter data in a chart, but setting it up has been more complicated. The new feature makes it much easier and more straightforward, so it is surely a feature that will be welcomed.
Setting it up
To try this I’ll use a copy of the Demo App – Beginner’s tutorial that’s available in QlikSense Cloud If you want to follow along, open it in Qlik Sense Cloud and then make a copy of the sheet ‘ Product details’. Then click on ‘Edit sheet’ in your new sheet.
The filter option is only available in the new authoring mode, so make sure you’r not in the old one (called ‘Advanced options’). I’ll be using the chart ‘Sales and margin by Product Group’ but since that is actually a master object, and you can’t use the new authoring mode on master objects, I’ll firts have to unlink it, to make it no longer a master object. Once that is done, we’re ready to go.
This is what the sheet looks like when we start
Adding a filter
Filters are based on Qlik set expressions, but do not fear, there is help available to create the expressions. To add filters you use this little area:
First step is to enter the field namn (no, you cannot use dimensions). Do that, either by clicking Add and then searching for the field namn or by dragging and dropping the ‘Region’ field and you get a dialog like this:
Selecting filter values
Just select one or more regions and we are done:
Chart with filter
To verify that it works, end edit mode and make some selections in the region field. Notice how the values in the other charts change, but not the values in our filtered chart, they will still be showing the values in the reion(s) we set in the filter (in my case Nordic). So far so good.
What does the filter affect??
But exactly what does the filter affect? It surely affects the data in the chart itself, but what about other expressions, like dynamic titles etc? Let’s try. Change the title of the chart to (you will probably need Advancd options for this):
=’Sales and Margin by Product Group. Total: ‘ & Sum(Sales)
And now you will have a sum added to your chart title. Switch to analysis mode again, and make some selections in the Region field. Notice that the sum in the title changes, so the filter does not affect the title.
The filter will only affect chart data, not dynamic titles etc. That’s important to be aware of if you are using dynamic titles.
Chart with filter and dynamic title. The filter does not affect the title.
Displaying the filter to users
As you might have noticed Qlik Sense shows the filter at the bottom of the visualization. That works pretty well in this case, but in many Qlik data models you have flags with name that are not so user friendly, or you might have fieldnames with prefixes or more cmplicated filters. If that is the case you can enter your own describing text as a footnote to the chart, like this:
Adding footnote in property panel
And you will get your own text instead of the default one:
Custom filter description in the footnote
Behind the scenes
If you take a look at the properties of your visualization (I use my own Chrome extension for this) you can find your filters in their own structure:
Filters structure in object properties
Using this structure Qlik Sense then generates the actual set expression (qContextSetExpression) that is used:
A common mistake when you start with Qlik Sense extensions is to forget about setting Initial data fetch in your extension. Typically you would include something like this in the initialProperties of your extension:
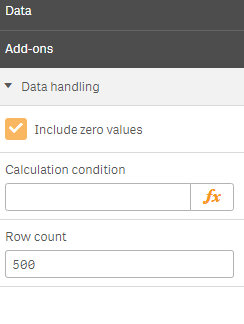
That would work, and make sure your extension gets the 500 first rows of data in the layout provided to your paint method. But sometimes you want the app developer to be able to set the number of rows fetched. In that case you can simply add the qHeight parameter to the property panel like this:
And the result is a new section in the property panel, where the app developer can set the number of rows initially fetched.
The property panel is a key part of your Qlik Sense extension. The aibility to set extension properties is what makes your extension both reusable and flexible. At the same time your options are much more limited than in the rendering part of the extension. And since this is Qlik Sense specific all of it, there is not so much information and examples available on the internet. So here are some patterns and techniques I find useful in extension development.
1. Use expressions always
Strings in the property panel can allow Qlik Sense expression by setting “expression: ‘optional’ “. Use that – always. This allows the app developer to use expressions for the property and thereby make the property dynamic. It also allows the app developer to reference a variable and use a variable extension to allow the end user to switch values for the property (horizontal/vertical for example).
It allows the app developer to use an expression, but doesn’t force her. Still a fixed string can be used, and probably will be used. And the good thing thing is you don’t have to bother about that in your extension code, you get this flexibility for free.
2. Dropdown with custom alternative
Sometimes you have just a few possible values for a property, or you want to help the app developer with a list of common values for a property. The dropdown component is a good choice for that. But you risk loosing the flexibility of the expression: the dropdown will only make it possible to select a value at design time, no possibility to make it dynamic or affected by a variable. Or the list is really not a complete list, there are alternatives for the more advanced app developer.
In those scenarios you can combine a dropdown with a separate field that allows expressions like this:
create a dropdown with your alternatives
add a ‘custom’ alternative to the dropdown
add a field with expression: ‘optional’ for the custom value
give the field a show function, that returns true if the selected value is ‘custom’
In your extension code you will need to check for custom values, something like this:
var width = layout.width === ‘custom’ ? layout.customwidth : layout.width;
3. Add properties to dimensions and measures
Sometimes you need a property for every dimension or measure. In that case you can extend the built-in dimensions and measures objects by adding new properties. You do this simply by setting the items property to the properties you want to add, and Qlik Sense will merge the default properties with the ones you hav defined. An example:
Note that the ref should begin with ‘qDef.’. That will mean it will be part of the measures property. To the app developer your roperty will look just like the built-in ones. You can do the same thing with dimensions.