Alternate state support in your extension II

A while ago I wrote a small post on how to add alternate state support to your extension: https://extendingqlik.upper88.com/adding-alternate-state-support-to-your-qlik-sense-extension/

I am happy to tell you that with Qlik Sense november 2018 this is now obsolete. In most cases you don’t need to do anything to have alternate state support in november 2018, it will work out of the box. For example the wordcloud extension:

You will get a new section in the property panel where you can set the state to use. The default setting, ‘inherited’ will mean that the chart will inherit its state from it’s parent (currently the sheet), but you can also specify what state you want.

November 2018 also includes support for managing alternate states and the selection toolbar shows selections for all


Qlik Sense november 2018 – with qsVariable

One of the new features of Qlik Sense november 2018 is the bundled extensions. If you install the bundle that’s included with the release (and I think you should) you will get a couple of extensions, one of them based on my qsVariable:

Based on, because Qlik has renamed it and made some modifications. Since it has a new name your existing apps that uses qsVariable will continue to do so, you will need to convert them to use the bundled version: You should probably do so, since Qlik will maintain the new version, and test and possibly fix it for new Qlik Sense versions.


Limit the number of rows in your Qlik Sense extension

A common mistake when you start with Qlik Sense extensions is to forget about setting Initial data fetch in your extension. Typically you would include something like this in the initialProperties of your extension:

That would work, and make sure your extension gets the 500 first rows of data in the layout provided to your paint method. But sometimes you want the app developer to be able to set the number of rows fetched. In that case you can simply add the qHeight parameter to the property panel like this:

And the result is a new section in the property panel, where the app developer can set the number of rows initially fetched.


My best advice to Qlik Sense extension developers

When you work a lot with something you develop opinions about how things should be done. Here is my list, after two years as an independent contractor, mainly with Qlik Sense extensions and mashup, and of course based on my experience from Qlik.

Git is the industry standard for version control, and it’s free.

1. Use version handling

There is no reason not to use version handling of your code. I use Git for everything, but if you are still using something else, that might be OK too. You probably should consider switching to Git, but as a developer that might be a decision taken over your head.

The benefits of using version control are enourmous. You can easily go back and find the reason behind a bug or the implementation behind that feature the customer now wants in another extension too. Invaluable!

You also should keep a version number in your qext file, and change it every time you deploy a new version. The main benefit of this is that you can see what version of your extension is in use in a Qlik Sense installation. I have described how to do this in a previous post.

2. Always test your extension in a browser

The developer console is an excellent tool for extension development. You use it to debug your javascript code, to inspect the HTML and CSS and to analyze the network traffic, including the web socket traffic. It can also be used to turn caching off, so you know that you are running the latest version. The browser included with Qlik Sense Desktop is not of much use for extension development. Even if you can open the console, it’s an environment your users do not use.

3. Stay in your sandbox

The extension framework gives you a HTML element for your extension. Stay inside it, unless you have very good reasons 
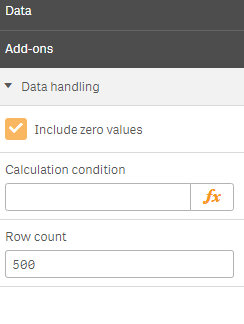
not to do so. That goes both for your javascript and CSS.

  • do not inject HTML elements outside of your own element
  • prefix your CSS rules so that it affects only the extension
  • scan only your element, use $element.find() rather than $(), or element.querySelectorAll rather than document.querySelectorAll
  • avoid html id’s, since they must be unique within the page. If you must use one (really only when you use a library that needs an id) make sure they are unique for each extension instance (test with multiple instances of the same extension)

There are occasions when you need to break theses rules, but only do it when it’s need for your extension functions.

4. Use modern development tools

Pretty soon after you have started with extension development you will grow out of the Qlik Sense dev-hub extension editor. A modern, nodejs-based environment, with a good text editor gives you a lot of benefits, and works well with version handling software. I would recommend the following:

  • a good editor. I mostly use Visual Studio Code, but there are others that probably are just as good.
  • a CSS preprocessor like less  helps you with prefixing css, add vendor prefixes etc
  • a lint tool, to find common errors an enforce good programming practices
  • possibly a preprocessor, to allow you to use modern javascript features and still work on older browsers

5. Always keep your extension backwards compatible

After a while your users will most likely want more functionality in your extension. They might want more interactivity, more rendering options, perhaps support for more dimensions and measures. You will probably add new settings giving your extension more flexibility. You might also find that some of the stuff you originalyy programmed was not perfect (that happens to all of us..).  But if you have deployed your extension to production, make sure that all your changes are backward compatible. If you don’t you will have huge problems when you deploy the new version, with breaking apps.

If you find it impossible to make your new extension backwards compatible you probably should not be making a new version, but a new extension, with a different name.

6. Base your rendering on only the layout

The model behind Qlik Sense extensions (and the built-in charts too, actually) is that the extension is based on a Generic Object, where you configure the Generic Object in the property panel and use the layout for rendering. Stick to that model, do not break it. If you need more data for your rendering, add it to the properties structure. Avoid:

  • creating HyperCubes and ListBox objects programatically, add them to initialProperties and the property panel instead
  • fetching variable values programatically, add expressions to the property structure instead (that also gives the app developers more options, like hard-coding values, or making them change automatically as selection state (or data) changes

It is however OK, even recommended, to call API methods for:

  • showing lists of available values in the property panel
  • making selections etc when the users clicks on buttons, menues or other parts of your UI

I have written on this before here and here.

How to find out what extensions and versions are installed on your Qlik Sense server

You have been running Qlik Sense for a while in production, with multiple apps, some extensions and mashups. Or, you are just starting to work on a Qlik Sense site, where you don’t really know what has happened before. And perhaps the extensions you are using in development are missing or they seem to be of an older version. How do you find out what is on the server?

Whenever you are running Qlik Sense, whether it’s the standard built-in client or a mashup, the client will call the server to find out what extensions (including mashups) are available. This call has the format:

https://[server]/[proxy]/qrs/extension/schema (+ xrfkey in server installation)

Dump of the extension list, taken from Chrome developer console

The reply you get is in JSON format, and contains all extensions available with their id (the qext filename) plus the contents of the qext file. It’s quite readable and when you look at it in the developer console you can expand the lines you are interested in.

This will give you the extension version number, provided you keep a version number in the qext file, which of course you do.


Some useful patterns for your Qlik Sense extension property panel

Building a panel

The property panel is a key part of your Qlik Sense extension. The aibility to set extension properties is what makes your extension both reusable and flexible. At the same time your options are much more limited than in the rendering part of the extension. And since this is Qlik Sense specific all of it, there is not so much information and examples available on the internet. So here are some patterns and techniques I find useful in extension development.

1. Use expressions always

Strings in the property panel can allow Qlik Sense expression by setting “expression: ‘optional’ “. Use that – always. This allows the app developer to use expressions for the property and thereby make the property dynamic. It also allows the app developer to reference a variable and use a variable extension to allow the end user to switch values for the property (horizontal/vertical for example).

It allows the app developer to use an expression, but doesn’t force her. Still a fixed string can be used, and probably will be used. And the good thing thing is you don’t have to bother about that in your extension code, you get this flexibility for free.

2. Dropdown with custom alternative

Sometimes you have just a few possible values for a property, or you want to help the app developer with a list of common values for a property. The dropdown component is a good choice for that. But you risk loosing the flexibility of the expression: the dropdown will only make it possible to select a value at design time, no possibility to make it dynamic or affected by a variable. Or the list is really not a complete list, there are alternatives for the more advanced app developer.

In those scenarios you can combine a dropdown with a separate field that allows expressions like this:

  • create a dropdown with your alternatives
  • add a ‘custom’ alternative to the dropdown
  • add a field with expression: ‘optional’ for the custom value
  • give the field a show function, that returns true if the selected value is ‘custom’

In your extension code you will need to check for custom values, something like this:

var width = layout.width === ‘custom’ ? layout.customwidth : layout.width;

3. Add properties to dimensions and measures

Sometimes you need a property for every dimension or measure. In that case you can extend the built-in dimensions and measures objects by adding new properties. You do this simply by setting the items property to the properties you want to add, and Qlik Sense will merge the default properties with the ones you hav defined. An example:

Note that the ref should begin with ‘qDef.’. That will mean it will be part of the measures property. To the app developer your roperty will look just like the built-in ones. You can do the same thing with dimensions.

Adding alternate state support to your Qlik Sense extension

One of the more advanced feature in QlikView is alternate state. It alllows you to have several different selections active at the same time. With set analysis expressions you can then combine your selection sets to gain valuable insights.

While alternate states are not exposed in the built-in Qlik Sense client, you can easily add them to your custom extension with just a few lines of code. Let’s see how.

Step 1: add a property panel field

The qStateName property already exists (check the Qix Engine API), so a first step is to map it to the property panel. Lets create a new section under “Addons”:

This assumes a HyperCube, $ is the default state which is always there. This is already enough for alternate state to work in your extension. If you enter a valid alternate state name in the property panel your extension will be connected to it. Problem is there has to be an alternate state in the app, and you need to know it’s name. Lets do something about that.

Step 2: add a listbox with existing alternate states.

Lets convert our property panel to a dropdown list, where the app developer can choose what state the object should be connected to. We do this by setting the component to ‘dropdown’ and adding a function to return the options:

Alternate states ar listed in the app layout structure, so we need to get the app layout and format the states in the format the property panel dropdown wants. The default state ‘$’ is not in the list, so we need to add that ourselves. For this to work you need to have the qlik module available in your extension.

Now you will have a dropdown list in your extension property panel, something like this:

Still doesn’t look much, does it… But it does it’s job. Now we just need a way to create those alternate states.

Step 3:Creating the alternate states

Well, actually you need to do this first. But there are different ways to achieve this:

  • there are extensions for this
  • you could do it in Engine API explorer, since its really a one-time thing
  • or, you could add it to the property panel.

The property panel is not really meant for this, since we are not updating the object properties, but the app properties, but still it’s pretty easy to do. You can add something like this to the property panel:

It’s really not more complicated than that. You will get an inputfield in the propertypanel. If the user writes anything in that field, an alternate state will be created. It will then show up in the listbox, so you can use it in your extension.

Conclusion

It’s really not at all difficult to add alternate state support to your extension. Probably you should do something to show the user that this chart belongs to an alternate state: you can use the header for that, or add some styling or an icon for charts that are in another state. I’ll leave that for you.

Qlik Sense pick() performance: a follow-up

A few weeks ago I wrote a post about a pattern I have used to make Qlik Sense apps more flexible and allow the user to choose what visualizations to show.  Feedback I got on this(from Rob Wunderlich) is that there is a performance problem with pick(), that Qlik Sense does not optimize pick calls quite as well as you might think, that it might evaluate function calls where the values are not actually used.

I vaguely remember this from Master Summit for Qlik  where I believe it was mentioned. At the same time I do know that Qlik from time to time makes improvements in the optimization, so it might not be true anymore. Anyhow, this is something you could easily verfify. And I’ve got a tool to make at least a first assessment of this, the Developer Tools extension. I originally made this to help finding id’s for visualizations, but later has added some timing features to it, that can give us a rough idea about performance in your visualizations.

Setup visualizations

To do this I made a copy of the example used in my previous post. You find it here. In it I made a new sheet and copied one of the visualizations using pick() into it. I chose the pie chart (not because I like pie charts, but because I wanted one with some data in it). I then made a copy of it, and in the copy removed all pick() calls, together with alternatives 2 and 3 in that call, leaving only the first one, which is the expression that will actually be used of the three in pick(). And I add the DevTool extension to the same sheet.

Run the test

When all is ready, I switch into analyze mode and click  on the DevTool button, which creates popups for the two charts. I then make some selections, use back and forward, and I get the following result:

The left chart is with pick(), the right one without. The most interesting figure is the one at the bottom right, the maximum calculation time. As you can see there is a significant difference: 147 ms compared to 57 ms.  Seems like Rob is wright: there is (still) a performance problem with pick(), even though in my test case calculation time is so small that users will probably not notice.

Conclusion

This is a very rough test. It’s main advantage is that you can do it quickly. Since there is such a clear difference between the two alternative the result that pick() is considerably slower can be trusted. And the fact that the no-pick alternative actually takes some time (57 and not 5 msek) means that there is some calculation going on, just taking the result from the cache would be faster.


Add flexibility to your Qlik Sense app with variables and pick()

One of the main uses of the Variable extension for Qlik Sense is to allow users to quickly with a click on a button switch dimensions or measures in a chart. This has been described in Qlik Community here and here.

But perhaps you want to change more on the click of a button. You need to change not only a dimension or a measure, but several. And a title, or a subtitle or whatever. In that case you can use the Qlik pick function:

pick(n, expr1[ , expr2,...exprN])
n is an integer between 1 and N.
pick( N, 'A','B',4, 6 ) 
   returns 'B' if N = 2
   returns 4 if N = 3

 Variable and Pick()

The combination of Pick() and a variable can be very powerful. It also has another advantage. Sometimes the expressions you need to switch between are fairly complicated. Setting them up in the property panel of the variable extension can be difficult, and it’s not really the right place for Qlik expressions. Using the pick function helps you keep your expressions out of the property panel and instead where they belong, in the chart setup or in a measure or dimension definition.

To illustrate this I’ve made a small example, available in the Github repository here. To try it you of course need to install the actual extension. If you don’t have that already, you’ll find it here. I have called it Switch dashboard, because what it does is that it in the same area of the sheets allows the user to switch between three different setups, Margin, Sales and Budget (the actual data and the charts are taken from the Consumer Sales demo).

Initially when you open the app it looks like this:

Click on the Sales button and it will change to:

Just about everything has changed: another KPI is displayed, dimension in the middle (donut!) chart, measure in both charts, titles. And if you click the Budget button, you will see a third setup, I’ll leave that to you to verify.

Setup

To set this up you use classic Qlik features, like script statements and expressions, using the pick function. But you could also use Qlik Sense dimensions and measures. Lets see how its done:

Step 1: define the variable and set default value in the script.

First we define the variable we will use. Using standard Qlik naming conventions I’ve called it vDashboard and added it to the script:

SET vDashboard = 1;

Remember that pick numbering starts with 1, so do not use zero. The plan is that 1 should be our first dashboard, Margin, 2 should be Sales and 3 should be Budget.

Step 2:  set up a chart dimension

Now we use the variable, together with the pick function to define dimensions. In the donut chart I’ve defined the dimension like this:

=pick(vDashboard, [Product Group Desc], [state_name], [Sales Rep Name])

This will mean that we use different dimensions depending on the value of the vDashboard variable.

Step 3: Define measures

But we want to make the measures switchable too. But since we will use the same measure in several places, I have chosen another method for measures. I have defined two master measures, called (not too much creativity here, I’m afraid) ‘Dashboard KPI 1’ and ‘Dashboard KPI 2’. Definition of those looks like this:

pick(vDashboard,
Sum([Sales Margin Amount])/Sum([Sales Amount]),
(sum([YTD Sales Amount])-sum([LY YTD Sales Amount])*0.2)/sum([LY YTD Sales Amount]),
Sum ([Budget Amount])/Sum ([Actual Amount]))

I then use those measures in the charts.

Expressions in Qlik can be a lot more complicated, so it’s an advantage to be able to use the expression editor and get the syntax correct for this. Also I have been consistent in the formatting, so that each pick alternative is on its own line.

Step 4: Labels etc

Finally we want to make sure that chart titles reflect the content. Luckily we can use pick() in the title definition too:

=pick(vDashboard,'Margin Amount Over Time','Sales Over Time','Budget Amount Over Time')

We can use this approach everywhere in the property panel wher an expression is allowed. (A note for you extension developer: make sure that as much as possible in your extension can be set up with expressions, that will increase the flexibility of your solution a lot).

Step 5 (and final): Set up the extension

Finally we need to make it possible for the user to actually change the value of the vDashboard variable, thereby switching the dashboard contents. We do this by adding the Variable extension to the sheet and setting it up like this:

As you can see this is really straightforward. We use the values 1, 2, 3 etc and labels showing what we display for the three alternative versions.

A more advanced setup is using the new dynamic values option, and have a Qlik expression returning the alternatives. That way you could have a different set of dashboards for different users. Only remember that the first alternative needs to be available for all users, since it will be the default.

Conclusion

The combination of the pick function and a variable (and the variable extension) makes really powerful solutions possible. And note that this is classic Qlik skills that are needed: Qlik expressions and the well-known pick function. You do not need to start with web development for this.

Accessing system data and variables in a Qlik Sense extension

Sometimes when you are building a Qlik Sense extension you need to get access to system data. This is espescially true if you are trying to build something a bit more generic. Perhaps you need a list of fields, or dimensions, or measures. Or you need to work with variables.

If you are new to Qlik Sense development you might look in the API documentation for methods to get the data you need. Don’t do that!! Qlik Sense extension model is based on the idea that you use one Generic Object, described in the extensions initialProperties, and modified by the user in the property panel, and possibly programmatically (but that’s really advanced). So while using the API methods to get additonal data is the approach to use in mashups or Web apps that access Qlik data, you should avoid using them in a masup.

Why you shouldn’t

If you do use these api calls in your extension, you will get problems:

  • you might easily get a memory leak, or a ‘Generic Object leak’, where you create lots of Generic Objects
  • you can easily lose contral of all callback functions running when the generic objects are revalidated
  • if the user makes a snapshot, the API calls will access the latest version of the data, not the one in the snapshot and possibly give the wrong data
  • if the user tries to export your extension to PDF or Excel it might break, since the service responsible for those export does not have access to live data, only to the snapshot

If you absolutely must use these calls, you should at least turn export to PDF and Excel of and not allow snapshots of your extension.

What you should do instead

Luckily there are alternatives. These API calls all create Generic Objects, but since the Generic Object is a very flexible structure, you can actually configure the Generic Object behind your extension to provide the data you need. Here is a little table of what you could use:

You needDo not use API callInstead add to initialProperties
List of fieldsapp.getList("FieldList")qFieldListDef
List of measuresapp.getList("MeasureList")qMeasureListDef
List of dimensionsapp.getList("DimensionList")qDimensionListDef
List of variablesapp.getList("VariableList")qVariableListDef
Variable valueapp.variable.getContent(..)qStringExpression or
qValueExpression

You find a working example of this in my syslist extension just don’t use it, it’s meant as examples of how to get the data and doesn’t really do anything useful. But do grab the initialProperties part you need for your extension.

It looks like this:

When should you use these API calls

Well, no rule without an exception. While you should avoid using these calls in the API for the rendering part of your extension, you should use them in your property panel, if you for example need to provide a list of fields to the user. And in a mashup, they are definitely very useful. And the API has other calls, which you might want to use, but that vill mainly be when the user does something, like clicking a button etc.